The sun is shining and I’m sitting comfortable and warm in the shade the day after alleged new owners turned up at the allegedly debt-free SOL where a team including a lot of youngsters put three goals past the league champions without conceding themselves. So the future’s not all bad.
But before we get to that future let’s take a few moments to look back on a season and some statistics we’d probably not want to revisit too often.
And I must caution you, I’ve led you towards a conclusion. You might want to give how I’ve done it a bit of critical thought*.
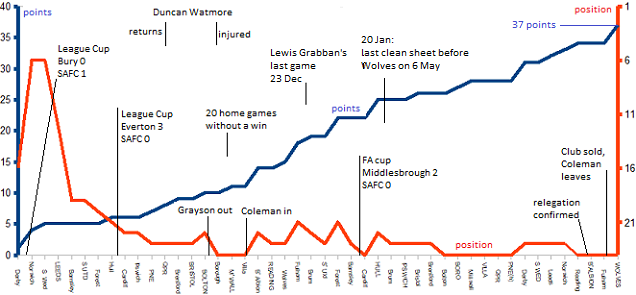
Firstly, here’s the graph
that I put on our facebook page a couple of days ago (with a couple of additions, and apologies to Carlisle Utd, whom we beat 2-1 in the 2nd round of the Carabao Cup on 22nd August).
After a decent enough start to the Championship season we stalled then moved rapidly towards the bottom of the league, which we reached after 16 games and the departure of our league-savvy manager. That wasn’t long after Duncan Watmore’s 6 game stint had ended, along with our hopes that he would make a difference in this division. Robbie Stockdale’s first tenure saw us bouncing along the bottom, after which Chris Coleman came in and talked the talk. Unfortunately, he didn’t also walk the walk, as we’ll see, and although we lifted for a while we could not stay out of the bottom three.
To continue:
36 players turned out for the first team in the Championship.
George Honeyman made the most apearances, with 42, followed by John O’Shea with 36, both figures including appearances as subs. Bali Mumba, Denver Hume and Luke Molyneux all made one appearance, including as subs.
- And at least one player who was in or had come through our own academy was named in every match squad of the season. That’s one not-so-sad stat I’d like to see repeated.
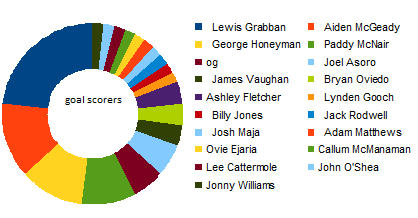
Half of those 36 players scored.
In the preceding season(s) this would have led to acclaim as we have suffered a dearth of scorers, and for how long? Unfortunately, although we remedied this in 2017-18 most of our scorers scored only one goal each.
During the season we scored 52 goals while conceding 80, and Lewis Grabban remained top scorer despite making his final appearance before Christmas. It wasn’t good enough. Derby County scored 70 and finished 6th.
Our away form was better than our home form
We won 4 away and 3 at home, and we drew 9 away as opposed to 7 at home. Our points per game average was 0.7 at home and just over 0.9 away, leading to an overall average of 0.8, which is about 1 point per game below that required to reach the playoffs. It could be argued that poor home form against the bottom clubs cost us our place in the Championship, and I’ll revisit this idea shortly.
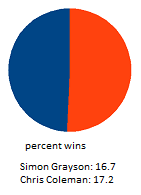
Changing our manager made little difference.
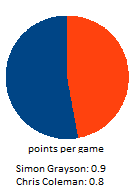
It may have made things worse. Chris Coleman had a slightly higher percentage of wins but, overall, he gained fewer points per game than Simon Grayson.
|
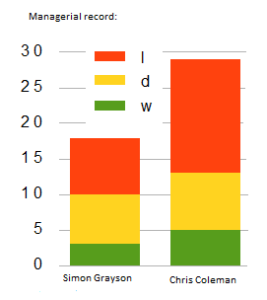 |
The difference was 0.1 points per game. Over Coleman’s 29 games that equates to 2.9 points, so let’s round it to three points. That would have given us 40 points. (including those gained by Robbie Stockdale, who also had a worse points-per-game rate thanGrayson – see below).
Both Burton and Barnsley went down with 41 points
and Bolton stayed up with 43. You could argue from that that those three extra points would have made no difference. But we lost to Barnsley (home) in January, Bolton (away) in February and Burton (home) in April. All three games were lost by one goal and Chris Coleman was in charge. Prior to this we had drawn at home to Bolton in what turned out to be Simon Grayson’s last game as boss. There are those who would say we threw away 8 home points against the teams which finished in the three places above us, with 6 of them lost on Chris Coleman’s watch.
To counter that, we lost 3-0 at Barnsley under Simon Grayson and won 2-0 at Burton under Chris Coleman.
You’ll recall that I recently wrote
When you’re balancing up Chris Coleman against Simon Grayson you might like to reflect on the figures and stats I’ve just quoted, and decide whether or not you agree with me.
 |
 |
 |
Here’s another way of looking at it
Simon Grayson’s average for points per game suggests he’d have got us four more points than we ended with had we had him over the season, including games when Robbie Stockdale was in charge. If we had gained three of them a point at a time by drawing against Barnsley (h), Bolton (a) and Burton (h) how might the season have ended? We’d have been on 41 points, the same as Bolton, with a better goal difference I’ll leave you to think about that.
*McCormick’s dodgy numbers: the arithmetic’s correct, it’s just the rest could be a bit wonky
![]()
Acknowledgements: Introductory and home page graphics by Jake, other images by me. Sources include the Statcat (of course) BBC Sport’s Championship table and footystats as well as my own material.
Splendid statistical summary, so thanks!
Fascinating material, John. As I work it out, albeit in a hasty way, Grayson’s three extra points would not have helped without one more, except to make us second bottom instead of bottom. To finish above Bolton, we would have needed to beat them at home and drawn away (or get the extra point somewhere else, while still improving the record against Barnsley and Burton as you described)
Home draws would have takn two points from Burton and Barnsley, giving them 39 each, the same as us. Their Gds would have worsened, ours would have improved – by how much?
a point at the Macron would have put us on 40 and Bolton would have been on 41 points. SAFC – third bottom.
So yes, you’re right, more or less. But would “last game” factors have changed? It was in the very last minutes that Bolton secured safety.
What ifs????
Dodgy numbers for a dodgy premise
John Mac
Coleman did try to alter the style of play. Our possession stats were better under him. We played more watchable football. We used younger hungrier players. Grayson had Grabban available to him – Coleman for the most part did not. Coleman was on the right track but had neither time nor money. He did as well as he could with the resources available.
and it was under him that we signed Kazenga Lua Lua and Lee Camp.
John Mac