I’m glad we can begin to look forward to next season. Although it might seem a grim prospect I’m sure there will be readers thinking it’s a bit less grim than it was, now that Moyes has gone. As to the thoughts of the Salut team, you’ve had opinions from Lars, Malcolm, Mick Goulding, Wrinkly Pete and myself, and you can look forward to some fine writing to come from, at least, M Salut and Pete Sixsmith, who will finish off the series.
Here’s something a bit different, though. A series of charts showing some of the key features of a season to forget:
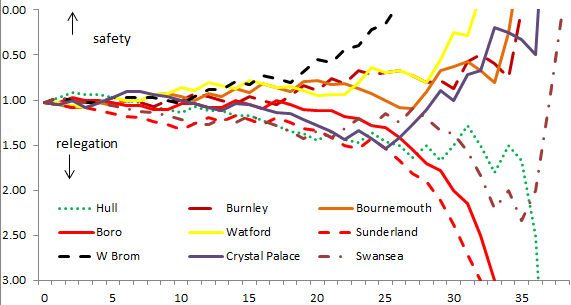
Firstly, the final graph in the relegation watch series.
Only three clubs finished with less than 39 points, which more or less vindicates my choice at the start of the series. Here’s how the task of getting to 39 got harder with each game for the bottom four, and easier for the other clubs. Within that group of four, a remarkable turnaround by Swansea enabled them to climb out of danger after Sunderland and then ‘Boro had succumbed, leaving Hull to sink as their season imploded:

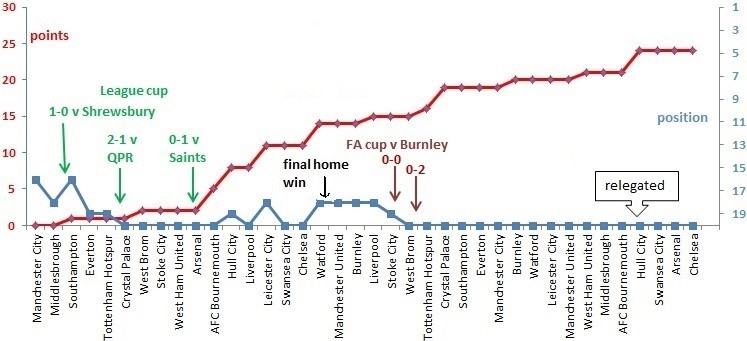
The next graph shows our season at a glance. We were never out of the bottom three.
Our final home win came before Christmas, our cup forays were pathetic and for long periods we flatlined:

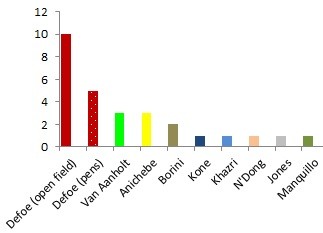
Defoe was one of very few shining lights. Although 31 players got game time during the season only 9 of them scored in Premiership games, and we sold one of those in January.
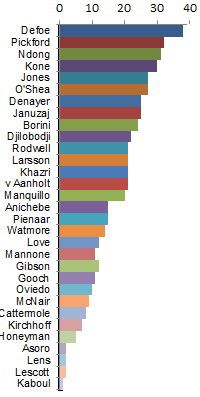
Too many players were selected for any semblance of cohesion to develop, 28 played in premiership games, and too many of those players were mediocre. And that’s before we take account of injuries – so many ligaments and hamstrings went that I have to question the club’s training and conditioning.
We conceded in 35 of 43 games, letting in three goals in as many games as we kept clean sheets, and we conceded 4 goals three times, while scoring 4 ourselves only once. We even conceded five goals once:
|
|
|
|
|
|
|
|
With stats like that there’s not a lot to be said. Praise to Defoe, and to Jordan Pickford, but not to Borini – who averaged less than a goal every 10 games. Praise to John O’Shea, who carried his years well, but not to Lescott, who hardly got on the pitch and was ineffective when he did. And that sorry tale could go on. For every player who performed there’s at least one in a similar position who didn’t – Cattermole or Rodwell, anyone?
And then, of course, our manager went. Looking at those graphs it becomes very clear that whoever takes over will have a massive job on his hands


The stats don’t lie in our case – thanks John.